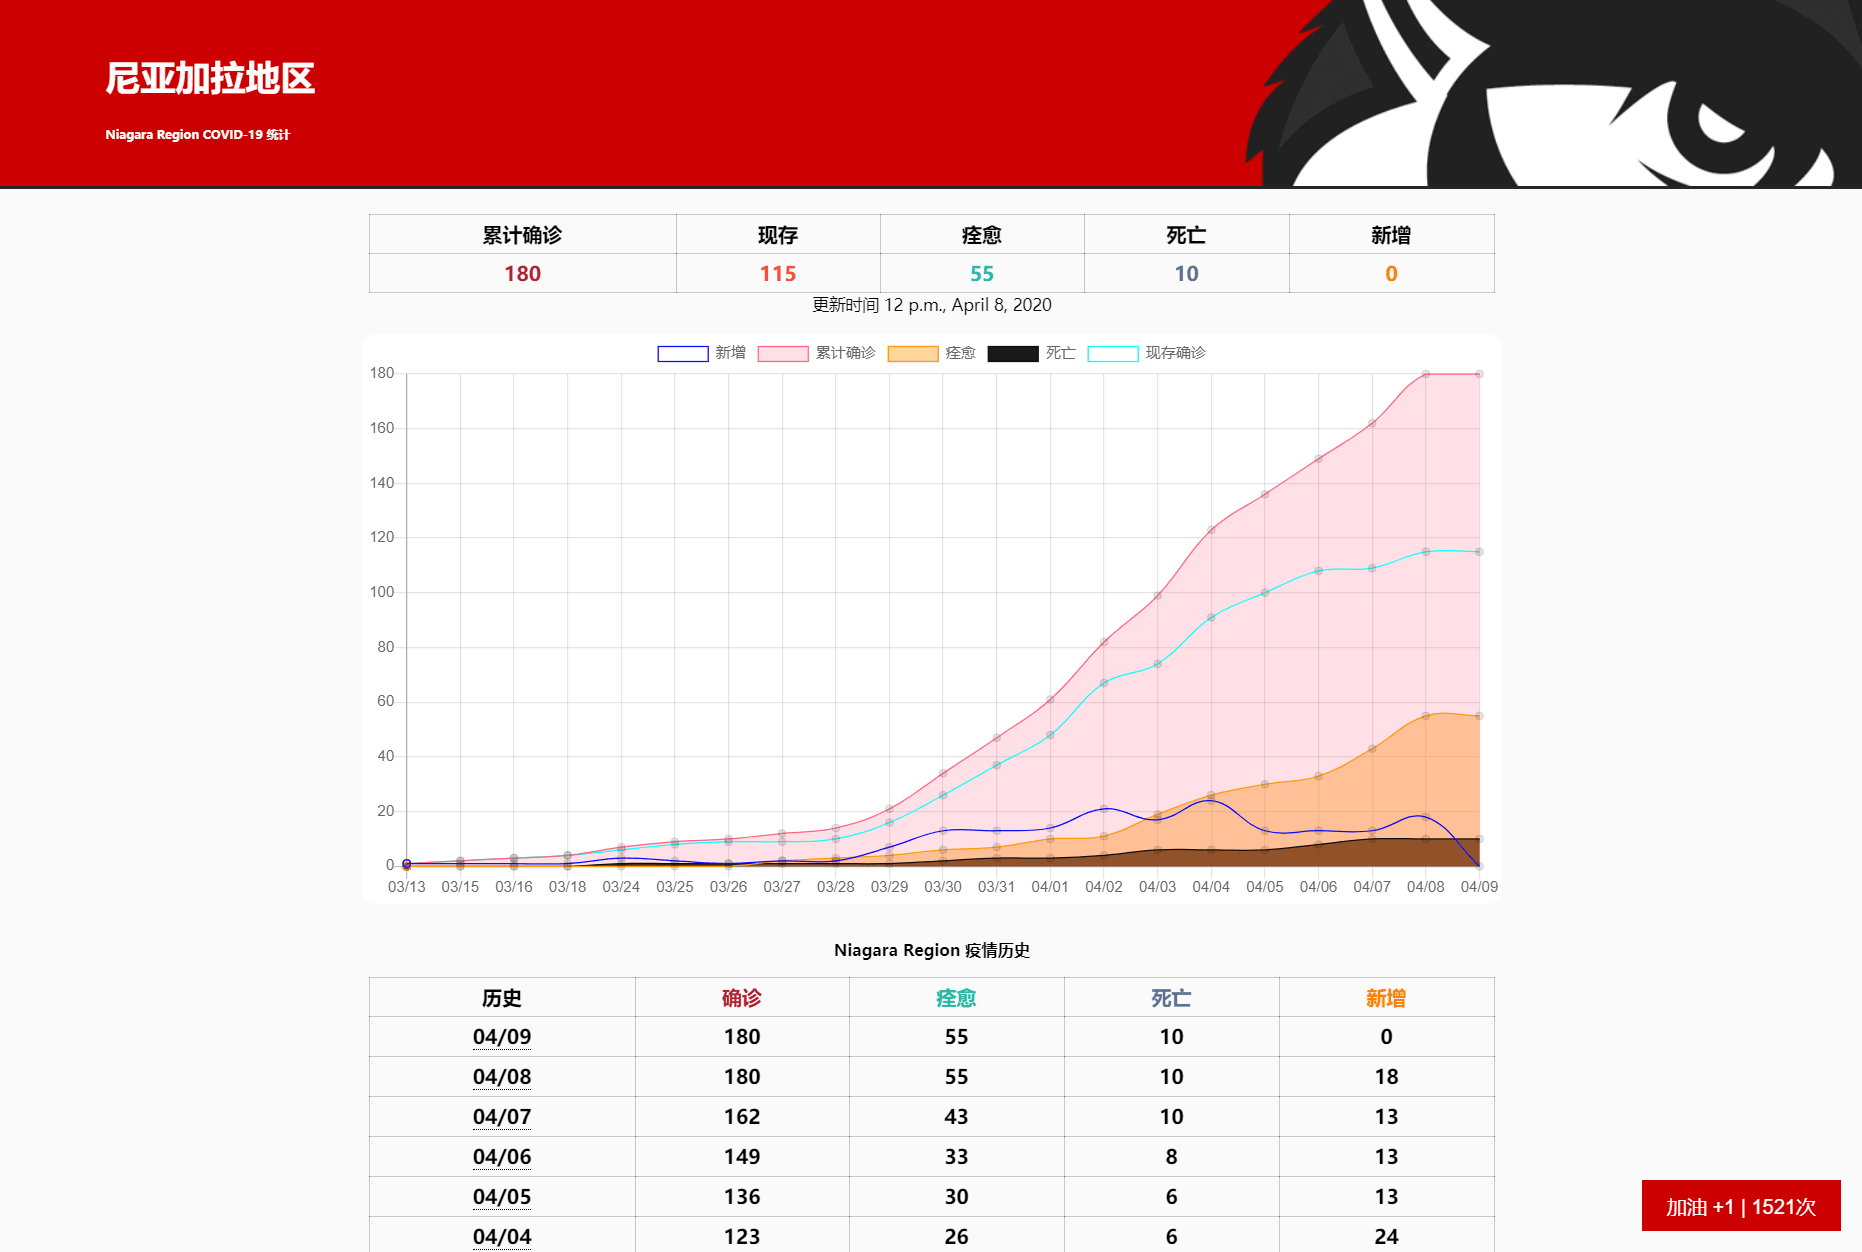
My homemade real-time COVID-19 dashboard for Niagara Region
For a while, Niagara Region barely published any data beyond a single number, so I had the idea of recording it myself and making my own charts. The site passed a thousand visits on the evening it launched, and plenty of visitors clicked the encouragement button too. The numbers are still pretty painful to look at, though...
My idea
Since the number of confirmed cases is published every day, I can scrape the data daily from these two URLs.
$html=@file_get_contents("https://niagararegion.ca/health/covid-19/default.aspx");
$html2=@file_get_contents("https://www.niagarahealth.on.ca/site/covid19casereporting");
I use DOMDocument to retrieve the three numbers.
// Confirmed Cases in Niagara
$strCaseNumbers = $xpath->query('//strong[@id="strCaseNumbers"]')->item(0)->nodeValue;
// resolved (have recovered)
$spnResolvedCases = $xpath->query('//strong[@id="spnResolvedCases"]')->item(0)->nodeValue;
// Death
$dNum=trim($xpath2->query('//table/tbody/tr[6]/td[2]')->item(0)->nodeValue);
Storing the data in a database using my own KDB
$data = array(
'date' => date("Y/m/d"),
'strCaseNumbers' => $strCaseNumbers,
'spnResolvedCases' => $spnResolvedCases,
'update_time' => $spnUpdateTime,
'death' => $dNum
);
$db->insert('covid-19-niagara',$data);
Scraping the data is that simple.
The front end uses Chart.js to draw line charts. After seeing encouragement buttons on lots of other websites, I wanted to make one too: each click increases the number by 1.
<button class="mdc-fab like" id="like" onclick="like();">加油 +1</button>
<script>
function like(){
req=new XMLHttpRequest();
req.onreadystatechange=function(){
if (this.readyState==4 & this.status==200) {
$data=this.response.split("\n");
console.log("Like: "+$data[1]);
document.getElementById("like").innerHTML = "感谢您的加油  "+$data[1]+"次";
}
};
req.open("GET","like.php?add=1");
req.send();
}
</script>
Open source and API access
The project will be open source, and a data API will be available to use for free.
API address: https://niagara.krunk.cn/api.php
The API returns the full dataset as JSON. You can use it directly or access it through KDB. (Please credit the source when using it.)
Visit the live data dashboard: https://niagara.krunk.cn/
Source code
https://github.com/KrunkZhou/COVID19-NiagaraRegion-Dashboard
(Open-sourcing the code and collecting the data takes work—leave a comment!)
Data sources: Niagara Region, Niagara Health
Thanks to Insiderdavidlai for helping improve the data, and to the student association for spreading the word.
Published 04/09/2020 · Krunk Zhou
Join the conversation